


Quick summary
Summarize this blog with AI
Power BI totals often do not add up because a measure is recalculated in the total's filter context instead of summing the displayed rows. That is correct for many percentages and distinct counts. Use an iterator such as SUMX only when the business rule requires a calculation for each category, order, or other entity before adding the results.
If the rows look right but the grand total looks wrong, identify which case you have before changing the formula. This guide uses four sales lines to reproduce three common problems, show their expected results, and validate the calculation in SQL. The CSV and measure definitions are included.
Quick diagnosis: which Power BI total needs fixing?
| Symptom | Likely explanation | Appropriate action |
|---|---|---|
| Revenue or another additive amount disagrees with an independent total | The selected population, source grain, relationship, or filter behavior may differ. | Check filters and modeling before adding an iterator. |
| Margin or conversion rate does not equal the sum or average of row percentages | The total needs the combined numerator and denominator. | Recalculate the ratio with DIVIDE; do not sum percentages. |
| Unique customers total less than the sum of category counts | The same customer appears in several categories. | Keep the distinct count when the requirement is unique customers. |
| A per-category threshold works on rows but qualifies too much revenue at the total | The rule is being applied once to the full selection. | Use SUMX over the category keys so the rule runs at its required grain. |
| The total is blank | The expression may require a single selected value, find no matching rows, or divide by zero. | Inspect the expression and data state. Use selection checks to establish the expected behavior. |
A category row has a category filter. The grand total does not have that individual row's filter, although relevant slicers, page filters, and security filters still apply. The measure is evaluated again in that broader context; a different result is not sufficient evidence of an error.
Reproduce the problem with four rows
Use Enter data in Power BI Desktop to create a table named Sales from this fictional input. Each row is a sales line. Set LineID and Quantity to whole numbers, CustomerID and Category to text, and prices and costs to fixed decimal numbers. All identifiers are populated in this fixture.
You can also download the four-row sales CSV and import it through the Text/CSV connector. Name the imported table Sales to match the formulas.
Use this fictional fixture for public practice. Keep customer and company data inside your approved Power BI or SQL environment; do not paste credentials, connection strings, or private records into public query tools.
LineID,CustomerID,Category,Quantity,UnitPrice,UnitCost
101,A,Hardware,2,100,70
102,B,Hardware,1,50,45
103,A,Services,1,300,60
104,C,Services,1,100,40
Create these as separate measures, not calculated columns:
Revenue =
SUMX ( Sales, Sales[Quantity] * Sales[UnitPrice] )

Cost =
SUMX ( Sales, Sales[Quantity] * Sales[UnitCost] )

Profit =
[Revenue] - [Cost]

Margin % =
DIVIDE ( [Profit], [Revenue] )

Customers =
DISTINCTCOUNT ( Sales[CustomerID] )
SUMX evaluates the line expression for each row and adds the results. Multiplying total quantity by total unit price would calculate a different value. Microsoft's SUMX reference explains the iterator's behavior.
Add Sales[Category] to the rows of a matrix and the four measures Revenue, Profit, Margin %, and Customers to its values. Format Margin % as a percentage with two decimal places; do not multiply the measure by 100 before applying percentage formatting.
| Category | Revenue | Profit | Margin % | Customers |
|---|---|---|---|---|
| Hardware | 250 | 65 | 26.00% | 2 |
| Services | 400 | 300 | 75.00% | 2 |
| Grand total | 650 | 365 | 56.15% | 3 |
The revenue and profit columns add up. The margin and customer columns intentionally do not.
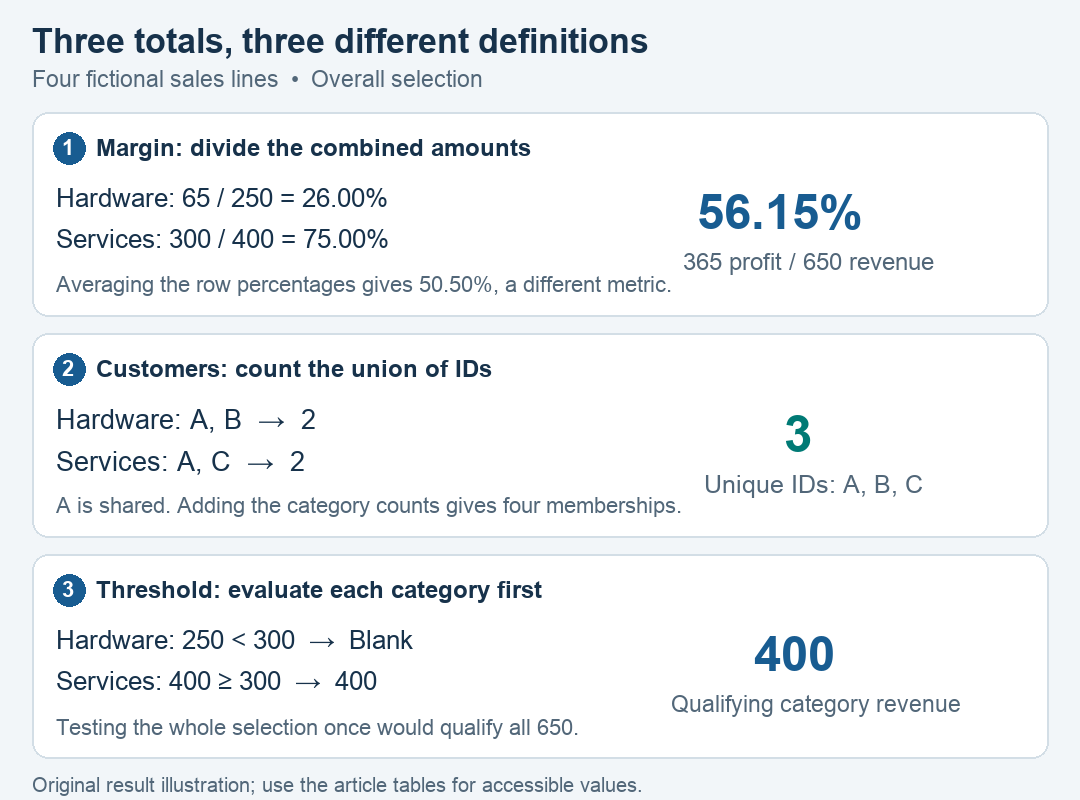
The measure expressions were executed against this four-row fixture in the anonymous DAX.do sandbox, including the overall result and customer/category selections. The SQL checks provide a separate calculation. The figures below are original illustrations of the resulting values.
Case one: recalculate a ratio from its components
Total margin answers, “What fraction of total revenue became profit?” It is 365 divided by 650, or approximately 56.15%.
Adding the row margins gives 101%. Averaging them gives 50.5%. Neither is the overall margin, because Hardware and Services have different revenue weights. An unweighted mean could be useful for a different question, but it needs a different label.
The original measure already expresses the intended total:
Margin % =
DIVIDE ( [Profit], [Revenue] )
The same pattern applies to conversion rates, defect rates, and other ratios: preserve the numerator and denominator, then divide at the reporting grain. A percentage column whose components have been discarded is a poor starting point for an overall rate.
DIVIDE returns blank for a zero denominator unless you supply an alternate result. Keep “not defined” distinct from a measured zero unless the business definition explicitly says otherwise. See Microsoft's DIVIDE reference.
Case two: distinct counts overlap
Hardware has customers A and B. Services has customers A and C. There are four customer-category memberships but only three unique customers across both categories.
The grand total of three is therefore correct for a measure named Customers. Adding the two row counts would count A twice. Microsoft's DISTINCTCOUNT documentation explicitly describes this non-additive behavior.
If the business actually needs memberships, define and label that different measure:
Customer-Category Memberships =
SUMX (
    VALUES ( Sales[Category] ),
    [Customers]
)
On this fixture, memberships total four. Do not rename that result “Unique customers.” The iteration grain is part of the definition: changing Category to Month would count customer-month memberships instead.
Also agree how missing IDs should behave. DISTINCTCOUNT counts a blank value. If unknown IDs should be excluded, use DISTINCTCOUNTNOBLANK and track unknown records separately. SQL's COUNT(DISTINCT customer_id) excludes nulls, so a SQL check and a DAX measure need the same missing-ID policy to be comparable.
Case three: apply a rule at the required grain
Suppose the agreed metric is: “Sum revenue from categories whose revenue is at least 300 in the current selection.” The threshold applies to each category, then the qualifying category results are added.
This tempting measure looks right on category rows:
Qualified Revenue at Current Context =
IF ( [Revenue] >= 300, [Revenue], BLANK() )
Hardware returns blank and Services returns 400. At the grand total, however, Revenue is 650, so the condition passes and the result is 650. The formula applied the threshold to the whole selection. It did not apply the threshold separately to each category.
Express the required category grain explicitly:
Category Qualified Revenue =
SUMX (
    VALUES ( Sales[Category] ),
    VAR CategoryRevenue = [Revenue]
    RETURN
        IF ( CategoryRevenue >= 300, CategoryRevenue, BLANK() )
)
The total is now 400 because only Services qualifies. Hardware remains blank, matching the definition that no revenue from that category qualifies.
Inside the iterator, referencing the model measure [Revenue] automatically turns the current category row context into filter context. That is why CategoryRevenue changes for each category. If you inline a raw aggregation instead of using a measure, you must reason explicitly about context transition; Microsoft's CALCULATE reference explains this distinction.
Use a stable category key from the category dimension in a real star schema when display labels are not unique. Confirm that the dimension filters the sales fact table correctly. The flat fixture uses Category directly only to keep the example small.
The same approach can apply to customer-specific caps, store-specific targets, or per-order rounding, but the iterator must use the entity to which the rule belongs. Iterating over the visible category labels is incorrect if the business rule is per order.
Check the result in SQL
This self-contained PostgreSQL query calculates the category rows and the overall total independently of the report. It includes a grouping flag so a real missing category cannot be confused with the grand total.
WITH sales (
    line_id, customer_id, category, quantity, unit_price, unit_cost
) AS (
    VALUES
        (101, 'A', 'Hardware', 2, 100::numeric, 70::numeric),
        (102, 'B', 'Hardware', 1, 50::numeric, 45::numeric),
        (103, 'A', 'Services', 1, 300::numeric, 60::numeric),
        (104, 'C', 'Services', 1, 100::numeric, 40::numeric)
)
SELECT
    CASE WHEN GROUPING(category) = 1
         THEN 'Grand total' ELSE category END AS category,
    SUM(quantity * unit_price) AS revenue,
    SUM(quantity * (unit_price - unit_cost)) AS profit,
    ROUND(
        100.0 * SUM(quantity * (unit_price - unit_cost))
        / NULLIF(SUM(quantity * unit_price), 0),
        2
    ) AS margin_pct,
    COUNT(DISTINCT customer_id) AS customers
FROM sales
GROUP BY ROLLUP(category)
ORDER BY GROUPING(category), category;
The expected output is Hardware 250 / 65 / 26.00 / 2, Services 400 / 300 / 75.00 / 2, and Grand total 650 / 365 / 56.15 / 3. SQL returns the margin as a number on a 0–100 scale here; the DAX measure returns a fraction and relies on percentage formatting.
For the threshold rule, SQL would first group by category, retain groups with revenue at least 300, then sum those groups' revenue. Applying the threshold only after summing the entire selection would repeat the same grain mistake as the first DAX formula.
Use custom totals for an explicit display requirement
Current Power BI table and matrix visuals offer Customize total calculation for numerical columns. Microsoft documents options including sum and average of displayed row values. The feature uses a visual calculation; it does not redefine the underlying model measure. See the official custom totals guidance.
Use this when the agreed requirement is about the displayed rows of that visual. Keep a reusable business metric in the measure layer when other visuals must use the same rule.
A custom sum of the displayed Customers rows still produces four memberships in this fixture. A custom average of Margin % still produces the unweighted 50.5%. The feature can calculate those values accurately while the metric label describes the wrong thing.
Before choosing a custom total, write its meaning in plain language and check it against the tiny dataset. Check its behavior after changing row groups, filters, or drill level. If the option is unavailable in your editing experience, use the measure definition that expresses the requirement.
Debug filters and modeling before adding a total patch
When the total differs from an independent calculation, make a temporary diagnostic matrix with the smallest useful grouping and the base measures. Add Revenue and Cost separately before investigating Profit or Margin.
- Check the population. Match date fields, date boundaries, status exclusions, customer selection, and security filters.
- Check the grain. Determine whether the source has one row per order or per line, and whether order-level amounts were repeated after a join.
- Check relationships. Verify unique dimension keys, the intended filter path, and unmatched keys. Adding an iterator does not repair a model that duplicates facts or filters the wrong population.
- Check filter modifiers. A measure using ALL or REMOVEFILTERS may deliberately ignore a selection. Confirm that this is part of its definition.
- Check displayed precision. Rounded row values may sum differently from the underlying full-precision amounts. Agree where rounding belongs if it is a business rule.
- Check the visual. Look for an existing custom total, a visual-level filter, a Top N selection, or a hierarchy level that changes which rows the reader sees.
If two separate reports still disagree after their definitions have been aligned, use the metric reconciliation playbook to trace source lineage, freshness, and population differences.
Validate more than the unfiltered grand total
A measure that happens to match one total may still be wrong under selection. Run these checks on the fixture before trusting a larger report:
| Selection | Revenue | Margin % | Customers | Category Qualified Revenue |
|---|---|---|---|---|
| All four lines | 650 | 56.15% | 3 | 400 |
| Hardware only | 250 | 26.00% | 2 | Blank |
| Services only | 400 | 75.00% | 2 | 400 |
| Customer A only | 500 | 60.00% | 1 | 300 |
With Customer A selected, Services reaches the threshold exactly at 300; Hardware has 200 and does not qualify. This tests the threshold boundary and confirms that the rule applies within the current customer selection.
Download all worked DAX measure definitions and use the totals validation checklist to record your business definition, selection, grouping grain, and expected result.
Also test no matching rows, a zero-revenue group, missing customer IDs, and a duplicated source line in a separate copy of the fixture. Decide the expected behavior before changing the measures. For a zero revenue denominator, the unmodified Margin % measure should be blank.
On large models, measure the cost of an iterator at the chosen grain. Iterating over millions of sales lines to express a category-level rule can do unnecessary work. Iterating over category keys is smaller, but performance still depends on the model and storage mode.
FAQ
Should every Power BI total equal the sum of its rows?
No. Additive amounts often do. Ratios, distinct counts, and time snapshots often do not. Decide whether the total means an overall measure or a sum of separately evaluated groups.
Can I fix every total with SUMX?
No. SUMX is appropriate when the definition requires evaluation at a particular row or entity grain. Using it to add unique customer counts can double-count customers, and using it to add margins does not calculate an overall margin.
Why is a calculated column not enough?
A calculated column stores a value for each row during model processing. A measure responds to the report's filter context. A row-level arithmetic column can be useful, but a column of percentages does not by itself define a correct total percentage.
What should I say when a stakeholder thinks the total is wrong?
Show a tiny example with the shared customer or unequal denominator visible. Ask which question the total should answer, then align the calculation and label. For reusable modeling and measure practice, see the Power BI interview practice project.


